
SEO is supposed to be strategic. There’s just too much work to do it all at once. By following my framework you’ll be able to easily surface extraordinary opportunities and prioritise your work accordingly.
In the last two articles I’ve covered the following topics:
This article is about projecting traffic increase after CTR optimisation and rank increase:
- How to calculate traffic lost due to unusually poor CTRs
- Predicting traffic after CTR optimisation
- Predicting traffic after rank increase.
Why is this important?
With this methodology, you’ll be able to highlight search queries and URLs that are worth the time, money and effort.
Decision Making
Let’s say we have two important queries that bring traffic to our website – query A and query B.
| Query | A | B |
| Rank | 5 | 5 |
| Impressions | 1,000 | 1,000 |
| Clicks | 100 | 50 |
| Actual CTR | 10% | 5% |
| Expected CTR on #5 | 10% | 10% |
| Difference | 0% | -5% |
| Traffic Loss/Gain | 0 | -50 |
Both queries appear on position 5 in Google with equal search volume / impressions. Query A has the expected CTR of 10%, while query B underperforms with CTR value of only 5%. This is costing you 50 organic clicks per month.
At this point you have a decision to make.
Which query do you work on next?
The obvious answers is let’s investigate query B and see why its CTR deviates from the expected value. The easiest solution would be to fix its snippet with CTR optimisation and lifting its CTR to where it should be.
As we know, that’s not always possible as there are external factors that may influence users’ click behaviour. If upon inspection you determine the snippet isn’t the problem, then your choice is clear. Work on the content and outreach for query A.
Here’s why:
| Query | A | B |
| NewRank | 4 | 4 |
| Impressions | 1,000 | 1,000 |
| Current Clicks | 120 | 60 |
| CTR | 12% | 6% |
The amount of effort to push query A and B from #5 to #4 is rewarded differently. Keep in mind this is a simplified scenario that doesn’t factor keyword difficulty, conversion rate/value or financial impact of various queries.
Scaling Your Work
You can make decisions like this manually with two or three queries but not thousands.
When you work with large amounts of data, it’s important to have a system that helps you identify surface opportunities and prioritise your work.
In my framework it’s as simple as sorting a spreadsheet by “potential traffic” or “revenue increase” and starting your work top down.
Calculating CTR-based Traffic Loss
This is useful for:
- Projecting post-optimisation traffic levels
- Normalising rank-based traffic increase
- Projecting combined outcomes.
Finding CTR Deviations
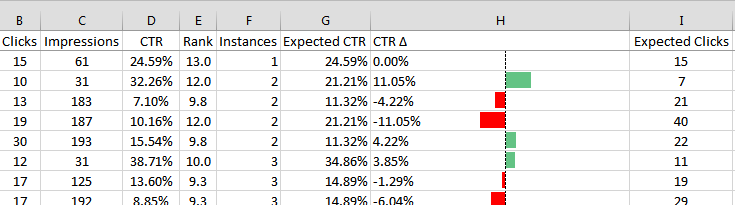
I’ve already explained how to calculate your CTR averages in the previous article. We know that’s the CTR we should have but for one reason or the other that’s not always the case. Now we take the CTR that we do have and find the difference: CTR Δ = Expected CTR – CTR
This gives us a spreadsheet that can be sorted by CTR deviations. Excel’s data-bar visualisation really makes it obvious when there are positive or negative deviations from the expected CTR values:

Just remember to filter out any low-instance queries (less than 5) as they may show unreliable averages:

Ascending sort will list the poor CTR queries at the top.

Descending sort (illustrated above) will show you queries with potentially outstanding snippets.
Calculating Expected Clicks
Our final step is to multiply the impressions and expected CTR values for each query (Expected Clicks = Impressions * Expected CTR). This gives us the expected clicks.

Run the formula across the entire column:

Calculating Expected Traffic
We know the expected clicks. We know the actual clicks. Working out the difference is now a trivial matter.

The resulting columns (J and K) show us traffic loss and gain:

Winners and Losers
Totals from each column (loss and gain) are actionable and represent a valuable metrics for SEO reporting:

Sorted in Descending Order
This is relevant for sorting surfaces queries that did exceptionally well. These are snippets we can learn from!
- Observe the snippets
- Detect positive patterns
- Apply on a site-wide level
Sorted in Ascending Order
This is for surfaces queries that went horribly wrong. These are snippets we can optimise and reclaim the lost organic traffic.
- Observe the snippets
- Detect negative patterns
- Remove on a site-wide level
Where to start? Fix the top ten queries!
I often find the top ten offender queries tend to account for 80% of total lost traffic in total. This could be ten or less URLs to work on, as multiple queries could belong to the same URL.
Setting Realistic Goals
The purpose of this predictive analytics framework is to highlight opportunities and help you prioritise work through some reasonable data interpretation.
When you produce this type of report, do not simply add up the values in the lost traffic column and claim that you can get it back. The sum of all lost traffic is what I call a “unicorn value”, a scenario in which you’ve managed to fix all your traffic loss through CTR optimisation.
Sadly, this is never the case.
There will be cases where the reason for low CTR is something outside of your control, such as the presence of a well-known brand or a really interesting universal result.
Predicting Rank-Based Traffic Increase
This is another cool thing you can do with our CTR averages. Since we now know the average CTR value for each rank for our website we can reasonably predict traffic for each query for each position in Google. This allows us to create predictive traffic analytics based on various ranking scenarios.
Take a query, multiply its impressions with the average CTR for each rank and you’ll get scenarios such as this:
![]()
This is powerful information because it tells you how much traffic you’ll gain based on your decision to focus on a query A instead of B.
Setting Realistic Goals
A reasonable starting point is “one up”. Work out how much traffic you’ll be getting if all your keywords moved one position up in Google. Better yet, focus on queries and pages that really matter to you and model the one up on a realistic set of targets.
Fine Tuning
The above scenario only factors in your average CTRs. But, of course, some of your queries are doing better than average, while others are doing worse. If you’re concerned about per-query accuracy, I recommend adjusting the projected CTR of different ranking scenarios in proportion with its current performance.
Example: Query A ranks on position 10 and has a CTR of 1%. The expected CTR on position 10 is 2%.
So, when projecting traffic for position 9 and its average CTR of 4%, we have to lower the expectation for query A to 2% based on its poor performance on position 10.
Combined Projection
Combining results that can be achieved for lower than expected CTR queries with rank increase creates an optimistic scenario, which indicates a query’s full potential. Just be mindful that CTR increase isn’t always possible; the same with rank increase.
Financial Impact
This is the only metric your management is likely to care for. How much revenue will be made if we focus on query A and page B, instead of query X and page Y. In column “W” we now have a dollar value assigned to each query.

Once you have traffic projections for each ranking position, all you have to do is add average goal value and your conversion rate. This is not so useful when dealing with online retail stores where products vary in price. For that to happen, additional work is required – query to URL mapping to start with, but that’s now taking us to advanced tips.
Advanced Tips
Query to URL Mapping
This data is available in Google’s Search Console, but not exactly easy to extract in bulk unless you’re using their API. It’s useful for setting specific goal value and conversion rate on a product level. Mapping of queries to URL also allows you to create URL traffic potential, a sum of all its query potential, whether it be based on CTR optimisation opportunities or rank increase.
SERP Analysis
Understand which elements appear on search results together with your query and if they have any negative impact on its CTR (e.g. carousel -10 points, local results -5 points, image results -5 points…etc).
Calculating Difficulty Score
Combine potential traffic or financial gain value against your favourite difficulty metric (keyword difficulty, pa…etc). Sort the spreadsheet by combined potential score, which is now a balance between difficulty and reward.
For your rank #2 for “Nike shoes”, there is no point going for #1 as Nike is there with page authority of 99. Your potential score will be low for a query that’s hard to move up even if it promises high traffic reward.
Projecting Non-Ranking Queries
Now that you have a wealth of data and a solid predictive analytics framework, you’re ready to import keywords from other sources. Your first stop is your AdWords data and Google’s Keyword Planner. This way you have a chance at injecting non-ranking queries into your projections.
Another source would be your market research or survey data designed for search query discovery.
Dan Petrovic, the managing director of DEJAN, is Australia’s best-known name in the field of search engine optimisation. Dan is a web author, innovator and a highly regarded search industry event speaker.
ORCID iD: https://orcid.org/0000-0002-6886-3211

Calculating CTR Averages Using Google Search Console Data
